Article
Service imports and exports | Key indicators - June 2023
In June, Canada experienced a widening merchandise trade deficit as both exports and imports faced declines. Merchandise exports saw a notable 2.2% drop, and imports also decreased by 0.5%. As a result, the trade deficit expanded from $2.7 billion in May to $3.7 billion in June compared to the previous month.
This decline in trade performance was exacerbated by disruptions in key trade infrastructure. A strike at British Columbia's marine terminals, significant trade hubs, had a substantial impact on trade operations, particularly affecting exchanges with Asian trading partners. The repercussions of this strike are projected to influence trade figures for the following month of July, particularly for containerized shipments.
Canada's dependence on British Columbia's marine ports is evident, as these ports handled 9.2% of exports and 5.0% of imports in 2022. The ongoing strike is expected to impact different commodities diversely, with bulk goods demonstrating more resilience. However, it's crucial to note that in-transit shipments, not factored into trade statistics as per international standards, might contribute to variances in reported data.
Another disruption to trade came from severe flooding in Nova Scotia. This flooding damaged rail lines serving the port of Halifax, impacting the movement of goods inland. While marine terminals resumed regular operations, the rail disruption potentially influenced overall trade activity.
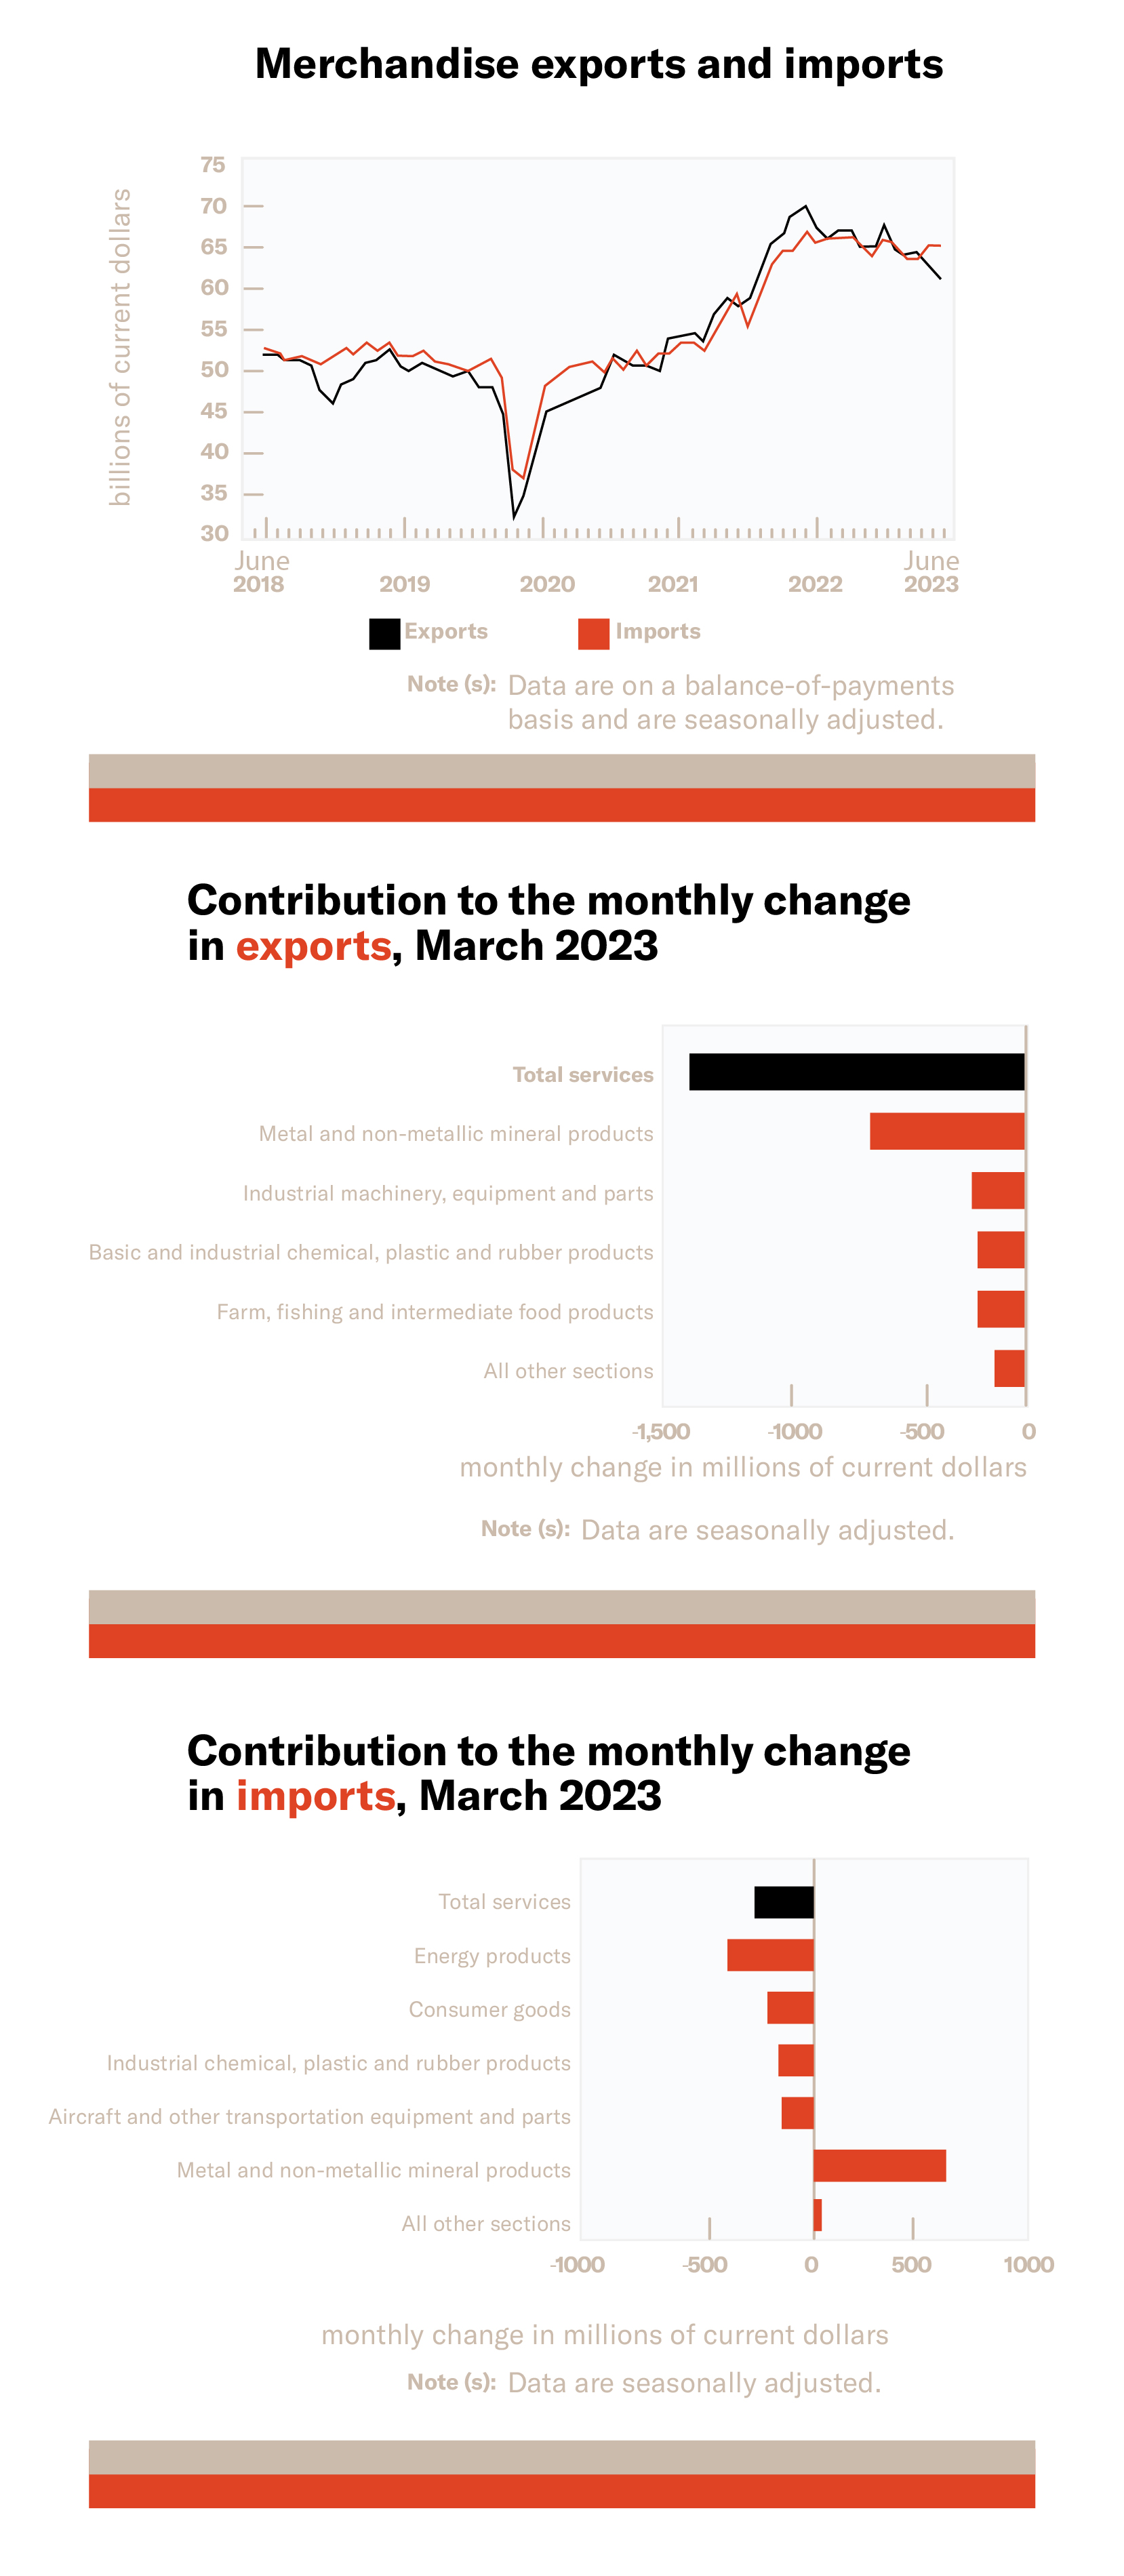
The decline in exports persisted for the second consecutive month in June, with a 2.2% drop following May's 3.0% decrease. Despite this decline, the value of total exports in real terms increased, signaling some economic resilience amidst the challenges.
On the import side, the trend was mixed. After a 3.0% rise in May, imports contracted by 0.5% in June. Notably, imports of energy products and consumer goods decreased, while imports of unwrought gold increased.
Trade imbalances were evident in both directions. Exports to countries other than the United States declined by 5.5%, contributing to a record-high trade deficit of $11.2 billion. With the United States, exports dropped by 1.2%, leading to a narrower trade surplus of $7.4 billion.
Looking at the broader quarterly trends, Q2 2023 saw a 3.5% decline in exports, driven by drops in energy products and farm-related goods. Imports in the same period fell by 0.3%, with energy products and industrial machinery experiencing significant declines.
Considering real terms (adjusted for inflation), Q2 exports fell by 0.4%. Conversely, real imports increased by 0.9%, with metal products and motor vehicles playing a major role.
In summary, Canada's trade landscape faced challenges from disruptions to key trade infrastructure, leading to decreased exports and imports. While the overall trade situation was mixed, Canada's trade performance demonstrated resilience amidst these challenges, especially in real terms.